1. Introduction
The ETC (Electronic Toll Collection) gantry system is a crucial facility for eliminating provincial boundary toll stations and implementing non-stop electronic toll collection. It possesses functions such as multi-path identification for passing vehicles and automatic fee calculation, enhancing the comprehensive perception of the operational status of the expressway network. By relying on gantry data, it can accurately obtain traffic flow, vehicle speed, and the overall operational status of the network.
This technology provides significant convenience for drivers and toll station staff, enabling automatic toll collection while also saving time. The ETC gantry system features functions like segmented tolling for passing vehicles, traffic surveys, video surveillance, and overspeed screening. After a vehicle passes under the gantry, the surveillance system installed on the gantry automatically identifies the vehicle and completes the toll calculation.
With the development of ETC applications, improving ETC service quality and reducing failure rates have become prominent issues. The reliability of communication between the On-Board Unit (OBU) installed on the vehicle's windshield and the Roadside Unit (RSU) on the ETC gantry system is particularly critical. Protocol conformance between the OBU and RSU is fundamental to the operation of the ETC system, encompassing core physical layer metrics, reliability, and communication process integrity (protocol conformance). Testing ETC gantries according to GB/T 20851-2019, JTG 2182-2020, and JTG 3520-2021 not only ensures standard compliance of related equipment but also guarantees the stability and reliability of the gantry system during daily use, laying the foundation for ETC application and development.
2. Test Standard Overview
The main test content of this solution is based on items 20-25 in Table 6.4.2 "ETC Gantry System Measured Items" under Section 6.4 "ETC Gantry System" of the《 JTG 2182-2020 Highway Engineering Quality Inspection and Evaluation Standard Part 2: Electromechanical Engineering》. These items include: Communication Zone, RSU Working Signal Strength, RSU Working Frequency, RSU Occupied Bandwidth, RSU Preamble, and RSU Communication Process. Specific details are shown in the figure below:
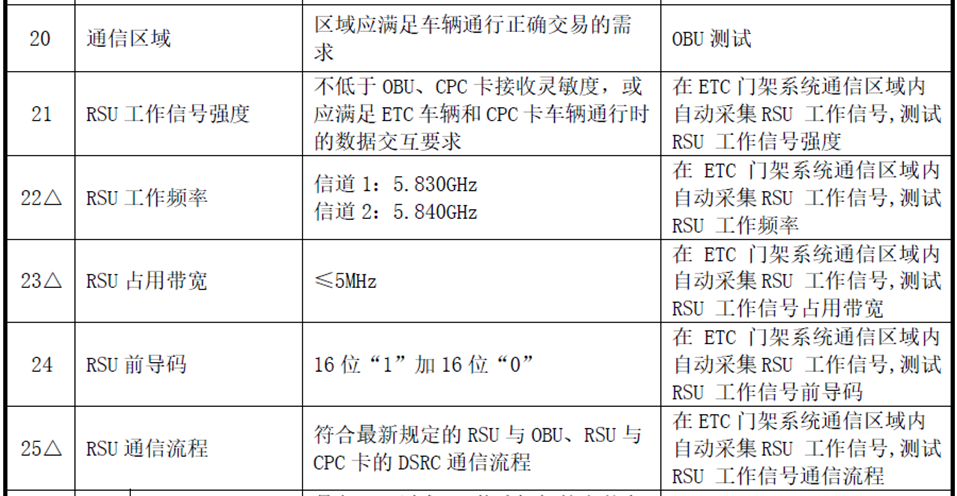
The specific test methods mainly refer to 《GB/T 20851-2019 Electronic Toll Collection - Dedicated Short-Range Communication》 and 《JTG 3520-2021 Highway Electromechanical Engineering Test Procedures》.
3. ETC Gantry Test Solution Comparison
3.1 Real-time Test Solution Based on Suspending Traffic on the Test Section
3.1.1 Solution Overview
The real-time test solution based on suspending traffic on the test section is currently the commonly used test solution in the highway transportation industry. This solution first requires suspending vehicle traffic on the test section (approximately tens of meters before and after the ETC gantry lane under test). When testing specific items, the RSU needs to be adjusted to the corresponding test state, test equipment is used for real-time measurement, and test results need to be recorded.
3.1.2 Equipment Used
This solution typically requires a handheld spectrum analyzer + omnidirectional antenna. Both must have a frequency range covering at least the ETC communication frequency, and relevant antenna parameters (antenna K-factor, cable loss, antenna gain) need to be known.
3.1.3 Test Procedure
Refer to "JTG 3520-2021 Testing Specifications for Highway Mechanical and Electrical Engineering".
3.1.4 Disadvantages of the Test Solution
● Complex testing process, requiring high expertise from test personnel
● Occupies the lane for extended periods, posing a risk of traffic congestion
● Difficulty in interpreting information source code; identifying service primitives is extremely challenging for test personnel
3.2 Convenient Test Solution Based on Analyzing Recorded IQ Files
3.2.1 Solution Overview
The convenient test solution based on recorded IQ files is a streamlined approach that involves processing, analyzing, and parsing IQ files recorded by a spectrum analyzer or RF recorder. This solution maximizes the efficiency of ETC gantry testing, greatly simplifies the complexity of the testing process, and reduces the risk of traffic congestion caused by lane closures.
3.2.2 Equipment Used
This solution requires one of two equipment combinations:
1)Spectrum analyzer (supporting IQ recording function, bandwidth ≥5MHz, recording time ≥15s) + Omnidirectional antenna + ETC Transaction Process Analysis Software ProEye.
2)RF recorder + Omnidirectional antenna + ETC Transaction Process Analysis Software ProEye.
3.2.3 Brief Test Procedure
Communication Zone (Field Strength Test):
1)Set the Device Under Test (DUT) RSU to a state of continuous carrier signal transmission. If continuous carrier signal transmission cannot be set, it may be set to a state of continuous operational signal transmission instead.
2)Positioned on the lane centerline within the test section, maintain the test antenna at a height of 1.2m above the horizontal ground plane. Slowly move the test antenna from the lane centerline position towards each of the two lane edges in turn. Measure the RF signal field strength emitted by the RSU and locate the boundary points where the field strength drops to the specified minimum value (113 dBμV/m). Use a tape measure to measure the distance from each boundary point to the lane centerline and record the values.
RSU Working Signal Strength / Working Frequency / Occupied Bandwidth / Preamble / Communication Process:
1)Install an OBU capable of normal communication with the DUT RSU on the test vehicle's windshield. Place the test antenna inside the test vehicle near the windshield, ensuring it can receive the downlink signal.
2)Drive the test vehicle normally through the corresponding lane under the DUT ETC gantry. Activate the IQ recording function on the spectrum analyzer or RF recorder before the test vehicle enters the ETC transaction zone. Stop recording after the transaction completes.
3)Open ETC Transaction Process Analysis Software ProEye, import the recorded IQ file, and analyze RSU Working Signal Strength, Working Frequency, Occupied Bandwidth, Preamble, and Communication Process.
3.2.4 Advantages of the Test Solution
1)Greatly simplifies the complexity of the testing process, avoiding errors caused by real-time testing missteps.
2)Core software provides test results with one click, lowering the skill requirements for test personnel.
3)Avoids prolonged lane occupation, reducing the risk of traffic congestion.
4)Accurately parses and locates information source code, solving the core difficulty of parsing application layer service primitives.
5)Supports screenshot saving of data, facilitating data storage and analysis.
4. Core Test Software - ETC Transaction Process Analysis Software ProEye
4.1 Software Overview
ETC Transaction Process Analysis Software ProEye is a professional test software designed to analyze the ETC system communication process (protocol conformance). It primarily analyzes recorded IQ files containing the ETC RF interaction process. It supports common IQ file formats; supports parsing RF indicators, key interaction statements, and characteristic data at the application layer and device application layer. RF indicators include signal strength, carrier frequency, frequency tolerance, modulation index, occupied bandwidth, etc. Application layer and device application layer parsing can automatically search for key interaction statements, such as preamble, BST, VST, SetMMI.rs, SetMMI.rq, etc. This is used to determine if the ETC system's communication process is normal. Supports providing a C# API for secondary development.
4.2 Software Structure Diagram
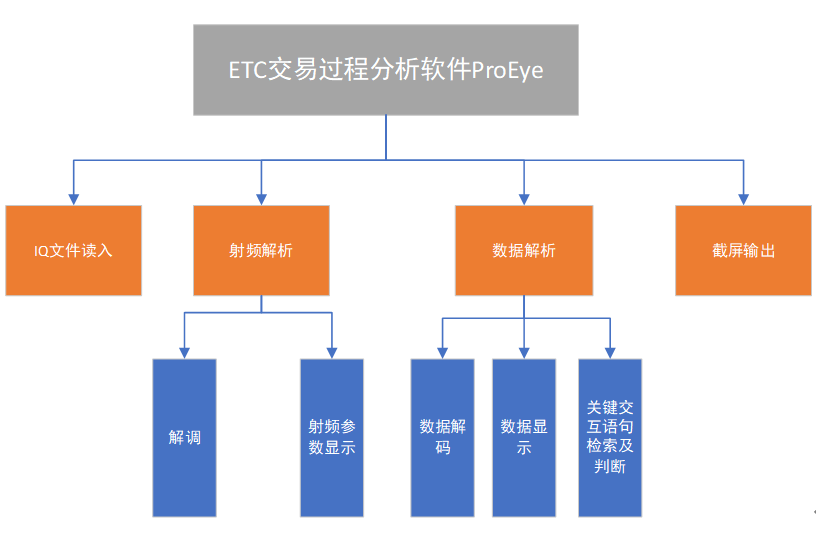
Software Structure Diagram
4.3 Software Interface Diagrams
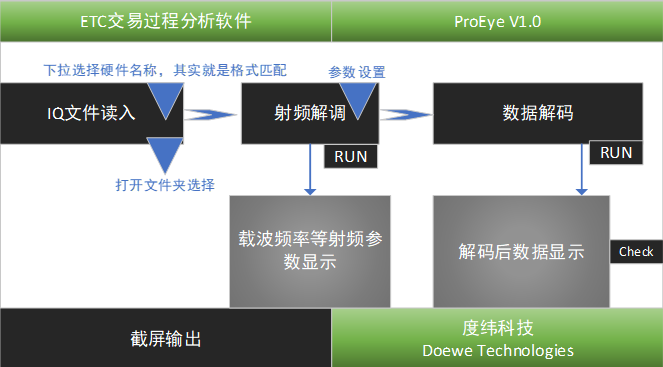
Software Main Interface Diagram
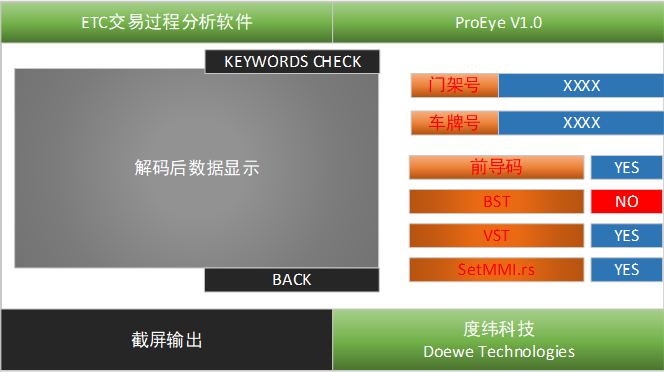
Data Parsing Sub-Interface Diagram