1. Introduction
This article aims to share some test methods for the "Effective Frequency Range" metric of loudspeakers. This metric appears in Part 5 of the GB/T 12060 series standards: "Methods of measurement for the main characteristics of loudspeakers". It is also frequently mentioned in testing standards for various other audio-related products. If you have questions about testing this metric, we hope this article provides some helpful insights.
2. Metric Interpretation
2.1 Metric Description
Figure 1 shows the relevant description of the effective frequency range metric from GB/T 12060.5. While descriptions in other standards containing this metric may vary slightly, the test methods are generally similar.
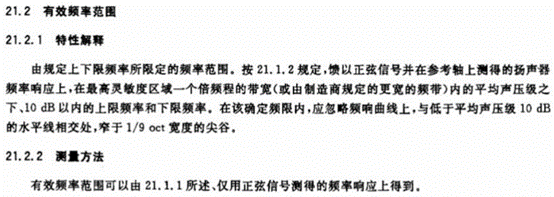
Figure 1
2.2 Test Method
First, the frequency response curve of the device under test (DUT) needs to be measured. Taking a megaphone as an example, the test setup connection is shown in Figure 2, and a sample frequency response test result is shown in Figure 3.
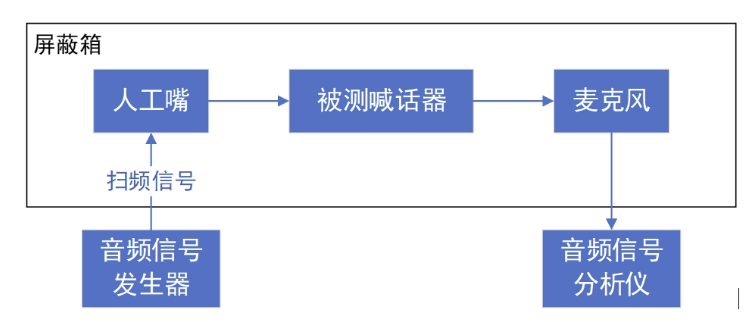
Figure 2
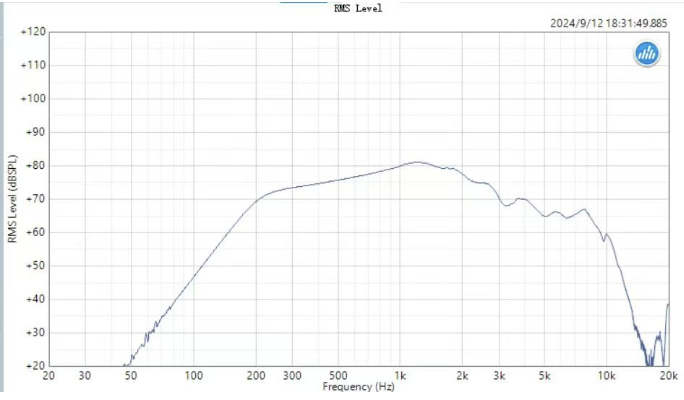
Figure 3 (This figure is for illustrative purposes only and may differ from actual test results)
Identify the frequency corresponding to the point of highest sensitivity on the frequency response curve. Using the curve in Figure 3 as an example, the highest sensitivity occurs around 1.5 kHz.
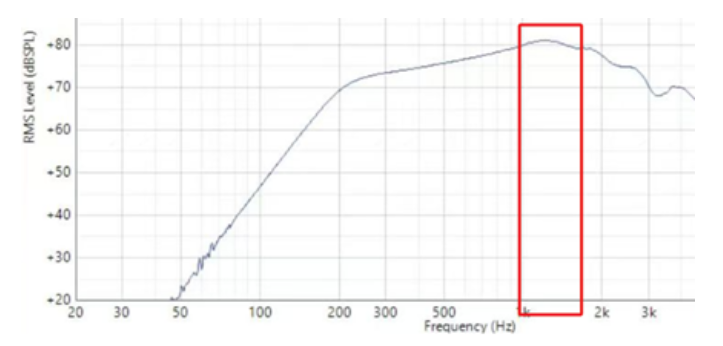
Figure 4
Refer to the octave band table in Figure 5 to determine which bandwidth the identified frequency belongs to. This bandwidth is used to calculate the average power of the signal within that one-octave bandwidth. Following Figures 3 and 4, 1.5 kHz falls within the 1400 Hz - 2800 Hz range. Therefore, we calculate the average sound pressure level of the signal within the 1400 Hz - 2800 Hz frequency range as P₀.
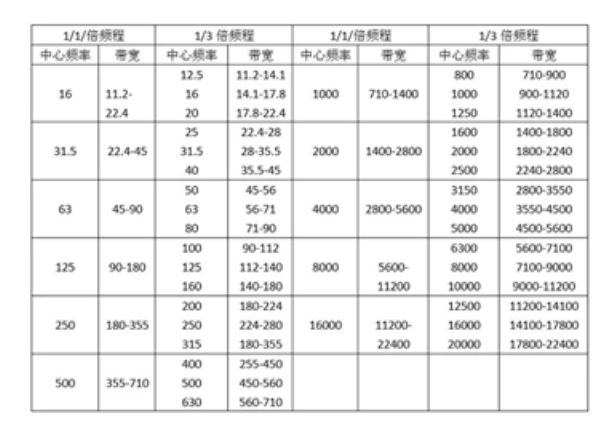
Figure 5
Decrease P₀ by 10 dB to obtain sound pressure level P₁. Draw a horizontal line on the graph at the level of P₁. This line will intersect the frequency response curve at several points. Neglect any intersection points spaced less than 1/9 octave apart. The frequency range defined by the remaining intersection points represents the effective frequency range of the DUT, as illustrated in Figure 6.
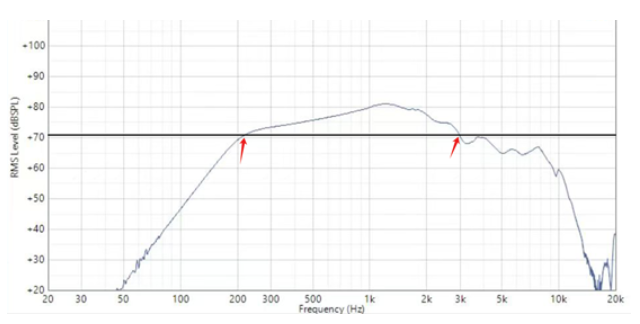
Figure 6
The above describes the test method for the effective frequency range of loudspeakers. Our company's professional Audio Analyzer is well-suited for accurately measuring this metric. Key parameters of the audio analyzer are listed below.
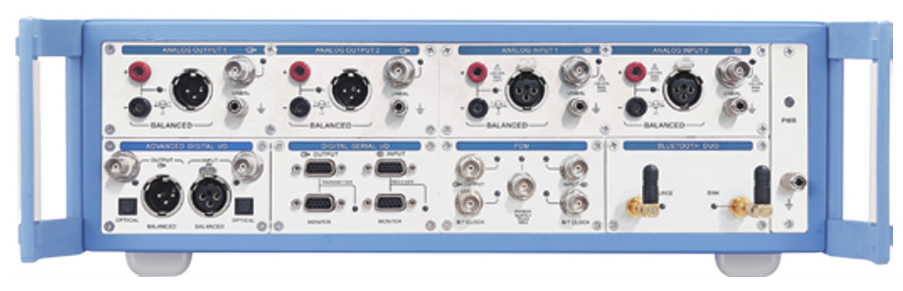
Audio Analyzer A10
● Standard support for SPDIF/TOSLINK/AES/EBU digital interfaces;
● Supports various digital interface expansions (BT/HDMI/I²S/PDM, etc.);
● Comprehensive and powerful electroacoustic analyzer functions;
● Codeless automation and full API interface;
● Support for LabVIEW, VB.NET, C#.NET;
● Automatic generation of test reports in various formats;
● Over 60 test functions, including Oscilloscope, Spectrum Analyzer, Continuous Fast Sweep, etc.
Furthermore, if you are interested in other audio-related testing, our company offers a wide range of audio test equipment, test accessories, and testing services. We also welcome any questions or feedback regarding the test method described above.