1. Introduction
Currently, most broadcast TV programs in China transmit signals wirelessly. However, issues like unstable or weak signals can occur during transmission, making field strength coverage testing of wireless transmissions critically important. Conducting large-scale field strength coverage testing is a complex process requiring close cooperation among multiple departments. It involves performing coverage tests, calculating the resulting data to verify compliance with national output requirements, and ensuring the coverage meets specifications. To deliver stronger TV and broadcast signals to audiences, field strength coverage testing is an essential process.
Traditional transmission tower field strength coverage test solutions require 1-2 personnel onsite to operate RF power test instruments and record test data, which is cumbersome. Additionally, the recorded test data cannot be visualized intuitively.
During coverage testing, GPS positioning is necessary to ensure measurement accuracy. Operators must record data, perform precise calculations of distance and field strength, and conduct scientific standard evaluations of coverage levels. However, the coverage range of a transmission tower cannot be visually represented as a field strength coverage map.
This document presents an efficient and convenient test solution using RF power test instruments, GPS, and the core functional software BroadCMS.
2. Solution
2.1 System Composition
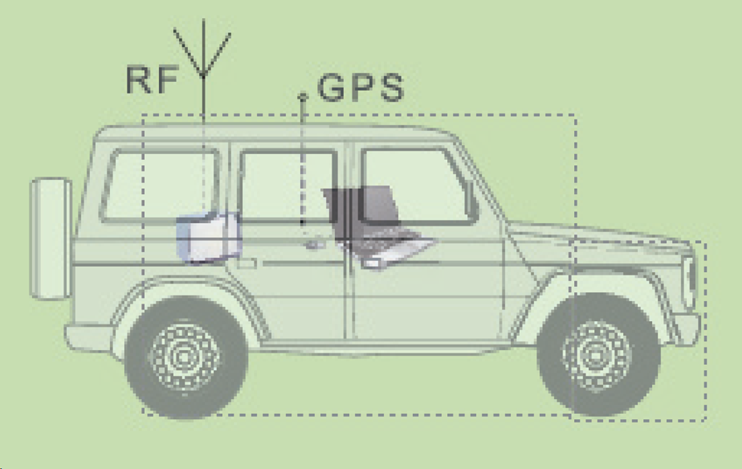
Figure 1: System Composition Schematic
The field strength coverage test system consists of four parts: an RF power test instrument (e.g., RSA2055A), GPS, a master control computer, and the BroadCMS field strength coverage test software.
2.2 Test Overview
The field strength coverage test system can be used for mobile outdoor testing within a vehicle. It comprehensively supports integrated field strength coverage road testing for AM, FM, CDR, PAL-D/K, and DTMB signals. The system is configured with road test platform software, a GPS reception system, and a map solution, enabling the plotting of point trajectories and line trajectories, and performing 2D map coverage effect evaluation. BroadCMS can be used with RSA2500A (Broadcast Modulation Analyzer), MP7600 (RF Recorder/Player), professional receiving antennas, and precision transmission cables.
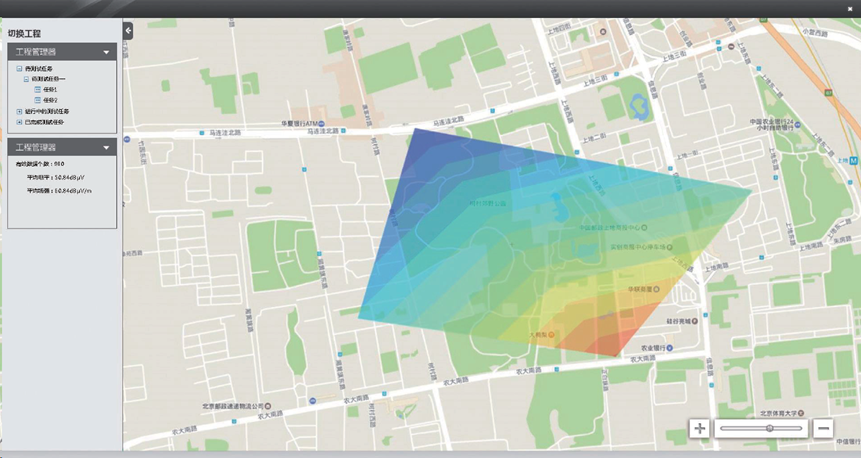
Figure 2: Field Strength Coverage Effect Schematic
2.3 Features & Advantages
● The coverage test software displays signal level parameters and performs strength statistics. It allows inputting antenna factors and cable losses as required.
● Automatically calculates field strength values in dBµV/m.
● Features GPS positioning and real-time communication with the test host, providing system status during mobile testing.
● Automatically saves test information, including signal strength, longitude, and latitude.
● Supports both online and offline map modes, with map caching functionality. Compatible with Google Maps, Bing Maps, etc.
● Displays the current test position and relevant test data in real-time on the map window.
● Test data can be exported as Google Earth files.
● Supports replaying the test process based on the test path and data.
● Features coverage analysis functionality, generating areal coverage analysis maps based on test data.
● Automatically generates test reports in WORD format.
● Supports custom threshold settings.
● Features statistical functions to view data distribution for current or completed tests.
● Capable of exporting data to Excel.
3. Core Software Introduction
3.1 Functions
a)Map Functionality: Test data information is displayed on the map. Move the mouse over a test point to expand detailed data information. See figure below:
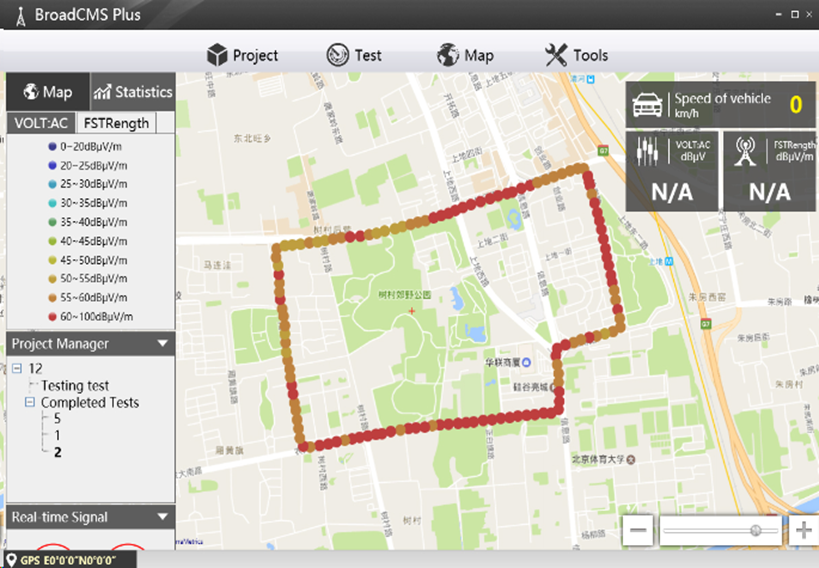
Figure 3: Test Data Information Schematic
b)Statistical Functionality: Statistics and report generation. All test data automatically generates statistical reports. See figures below:
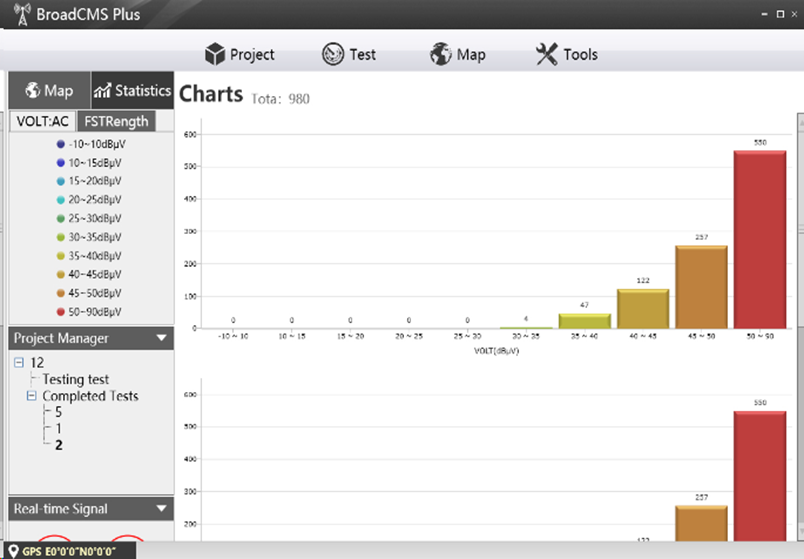
Figure 4: Statistics and Report Generation Schematic
Users can switch chart types (histogram, pie chart, 3D chart) by clicking the arrows. See figure below:
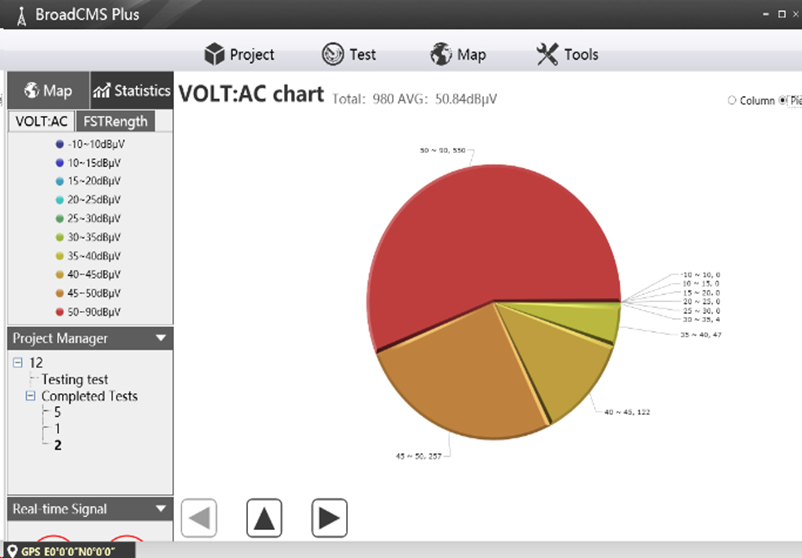
Figure 5: Pie Chart Schematic
c)Testing: Create a new test segment via the test button in the toolbar. See figure below:
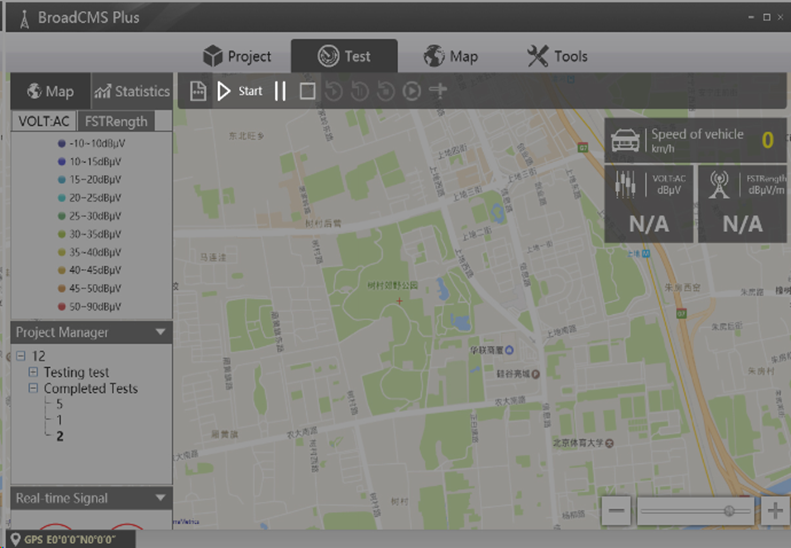
Figure 6: New Test Segment Schematic
d)Replay: Open a completed test segment to load all data onto the dynamic map and charts. Users can utilize the replay function. See figure below:
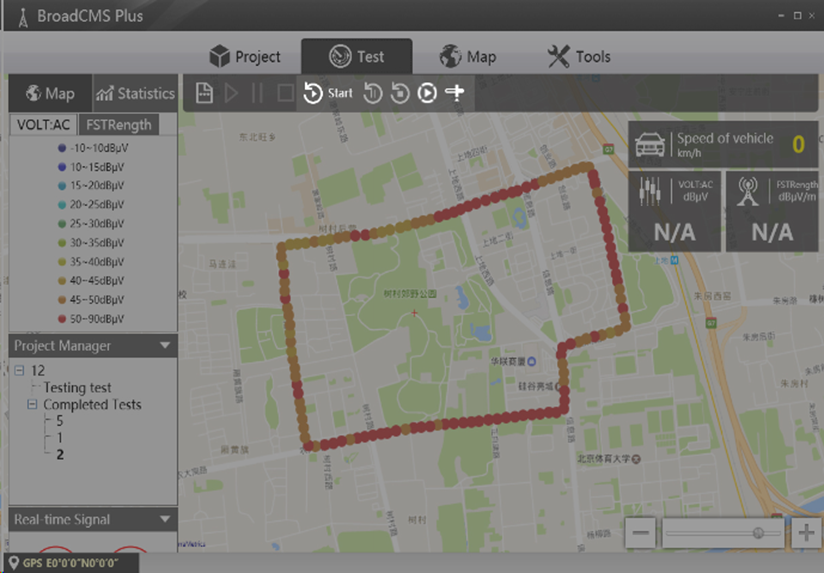
Figure 7: Replay Function Schematic
e)Mark Transmission Towers: Mark (add) transmission tower location information on the map. See figure below:
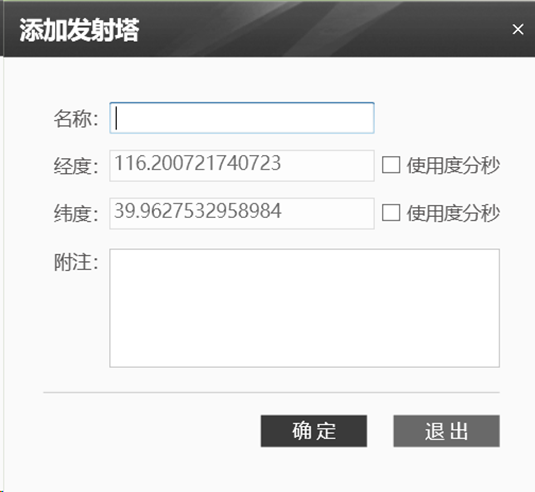
Figure 8: Add Transmission Tower Schematic
f)Coverage Schematic
Supports coverage schematic functionality to visualize coverage quality. Signal strength in the schematic is displayed using colors corresponding to different field strength/level intervals set in the coverage map thresholds. Generates areal coverage analysis maps based on test data. See figure below:

Figure 9: Field Strength Coverage Schematic
4. Introduction to Typical Test Instruments
Typical test instruments include: RWC2500A Plus, MP7600, AMA310X.
For BroadCMS testing, the RWC2500A Plus (Broadcast Modulation Analyzer), MP7600 (RF Recorder/Player), and AMA310X (Broadcast TV Coverage Test System) devices operated and sold by Doewe Technologies fully meet the requirements.
RWC2500A Plus Broadcast Modulation Analyzer
This device is a professional broadcast modulation analyzer primarily used for AM/FM transmitter testing. It can comprehensively test RF parameters, modulation performance, and audio aspects as a standalone unit.
The RWC2500A Plus can generate baseband audio signals, allowing configuration of frequency, amplitude, and other parameters. It provides multiple interfaces: balanced, unbalanced, digital, with one-click switching for user convenience.
In the test overview module, users can directly view results for all test items in the Modulation Analyzer and Audio Analyzer. It supports saving test reports locally or to a PC.
The RWC2500A Plus analyzes demodulated baseband audio signals, allowing intuitive viewing of audio waveforms and spectra, and measurement of distortion and other metrics. Please refer to the RSA2500A product brochure and related materials for specifics, or contact our company.
MP7600 RF Recorder/Player
The MP7600 is a high-end RF recording and playback device, an ideal tool for RF engineers conducting field signal testing and acquisition. As a standalone unit, it features real-time RF signal analysis, recording, and playback. It boasts a maximum real-time RF signal analysis, recording, and playback bandwidth of 100MHz, with support for adjustable bandwidths from 2MHz to 100MHz. It includes spectrum analysis and power measurement functions to meet diverse application needs.
The MP7600 comprehensively supports standards including FM/RDS/TMC, HDRadio, DAB, DVB-T/T2, DVB-S/S2, CMMB, ISDB-T, ATSC-MH, T-DMB, DVB-C/C2, DTMB, NTSC/PAL/SECAM, and DTH. Beyond broadcast TV standards, it also supports GPS, CNSS, GLONASS, and GALILEO signal acquisition and playback. During standalone playback output, the center frequency and output power can be customized, with an output signal noise floor below -160dBm/Hz, enabling interference environment simulation.
AMA310X Broadcast TV Coverage Test System
Features multiple industry-leading test functions. Supports DVB-C/S/S2, FM, PAL D/K, and DTMB (GB20600-2006) testing tailored for Chinese requirements. Also includes DOCSIS 3.0/ C-DOCSIS upstream/downstream analysis and optical input test interfaces (high-end version). Features real-time demodulation output, supports RF input/ASI input real-time color decoding playback, and supports large card decryption. Its sophisticated design and rich test functionality set a new benchmark for test instruments in the industry.
● Dual LCD displays for separate image/spectrum and test parameter viewing, facilitating observation.
● Test frequency range covers 5-2150MHz.
● Supports modulation standards DVB-S/S2, DVB-C, DAB, DTMB, and DOCSIS 3.0/C-DOCSIS testing.
● DTMB (GB20600-2016) supports: Full-mode demodulation testing RF; Real-time demodulated TS output; Online decoding observation; Support for MPEG2 SD/HD, H.264 SD/HD, H.265/AVS+ HD/UHD; Audio decoding playback; Carrier level testing; MER and BER testing; Channel parameter parsing (displays baseband parameters during decoding); SFN echo testing.
● Digital TV supports modulation constellation diagram display for DVB-S/S2, DVB-C, and DOCSIS signal modulation imbalance and phase error analysis. ZOOM magnification displays an enlarged constellation diagram for each quadrant. Supports constellation diagram freezing.
5. Conclusion
The ultimate goal of the field strength coverage test solution is to evaluate the effectiveness of signal transmission coverage for the user. Utilizing the RF power test instruments provided by Doewe Technologies enables highly efficient integrated field strength coverage road testing for AM, FM, CDR, PAL-D/K, and DTMB signals. Remote control of the equipment significantly enhances test flexibility and efficiency. Most crucially, field strength coverage testing yields highly precise data from the test results. This precision is essential for accurately identifying areas of strong and weak signal. Readers interested in learning more about our products and solutions can contact our company by phone (+86-10-64327909).