1. Solution Overview
Throughout the entire lifecycle of a photovoltaic power plant, the energy conversion efficiency of the inverter directly determines how efficiently each watt of sunlight is fed into the grid. The irradiance fluctuations throughout the day—from low illumination in the early morning and evening to strong midday sunlight, and then to cloud cover, dust accumulation, or temperature increases—cause dynamic changes in the output voltage and current of the photovoltaic array. If the inverter's real-time performance under different irradiance intensities and temperature fluctuations is not systematically tested, it is easy to underestimate power loss, misjudge the margin for heat dissipation design, or even miss the optimal opportunity for algorithm optimization, ultimately leading to high levelized cost of electricity (LCOE). Furthermore, certain regions (such as roadside facilities) have set strict testing requirements for photovoltaic products and introduced corresponding standards. For example, the GBT 24716-2023 "General Technical Specifications for Solar Power Systems for Roadside Facilities" outlines clear performance requirements for inverters and photovoltaic systems, and meeting these standards necessitates relevant testing.
Therefore, it is necessary to build a testing platform that, under a unified time base, can simultaneously collect voltage, current, and instantaneous irradiance on the DC side of the photovoltaic array, while also monitoring the output voltage, current, and power on the inverter's AC side, and aligning and comparing the data in real time. This process is a key step in evaluating the inverter efficiency curve, optimizing control strategies, improving overall power generation efficiency, and ensuring compliance with industry standards.
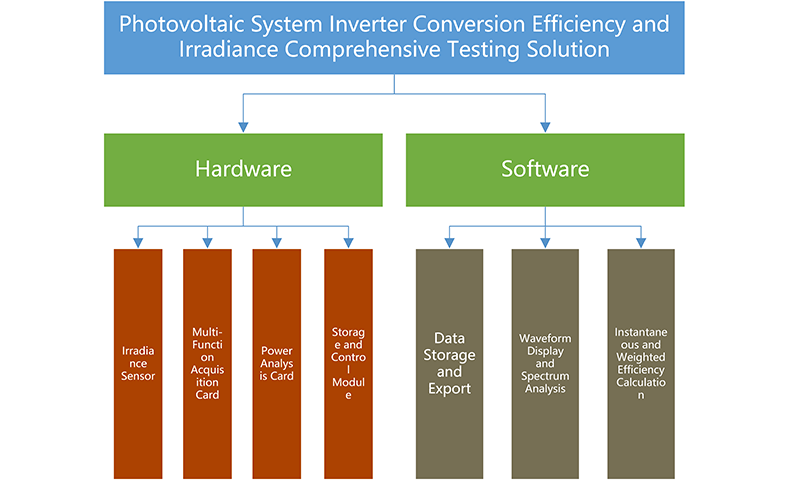
This solution focuses on the inverter conversion efficiency and irradiance characteristics of photovoltaic power generation systems. By collecting the voltage, current, and irradiance signals from the photovoltaic array on the DC side and simultaneously monitoring the output voltage, current, and power on the inverter's AC side, the data acquisition system can calculate instantaneous conversion efficiency, I-V curve characteristics, and power loss distribution in real-time. This helps users assess the performance limits and energy utilization of the inverter under different irradiance conditions. The high-precision, synchronized collection of DC/AC electrical parameters and irradiance intensity enables testers to quickly identify efficiency bottlenecks, verify control strategies, and provide reliable data support for component selection and inverter algorithm optimization, whether under outdoor or laboratory conditions. The overall system architecture diagram is shown below:
2.Test System Description
2.1 Test System Principles
The system consists of both hardware and software components. The hardware part includes the PXIe data acquisition system and the irradiance sensor. The system is equipped with two power analysis cards, which can simultaneously measure 8 channels of voltage and 8 channels of current, covering the input/output power on both the DC side of the photovoltaic array and the AC side of the inverter. Additionally, a multi-function acquisition card is included to collect signals from the irradiance sensor and can be expanded to collect analog quantities such as temperature and strain as needed, achieving integrated collection of environmental and electrical parameters. All channels are synchronized by the PXIe backplane's unified time base, and data is directly written into the high-speed storage module of the acquisition system to ensure the completeness and continuity of long-duration, high-frequency test data, supporting real-time waveform viewing, efficiency calculation, and spectrum analysis.
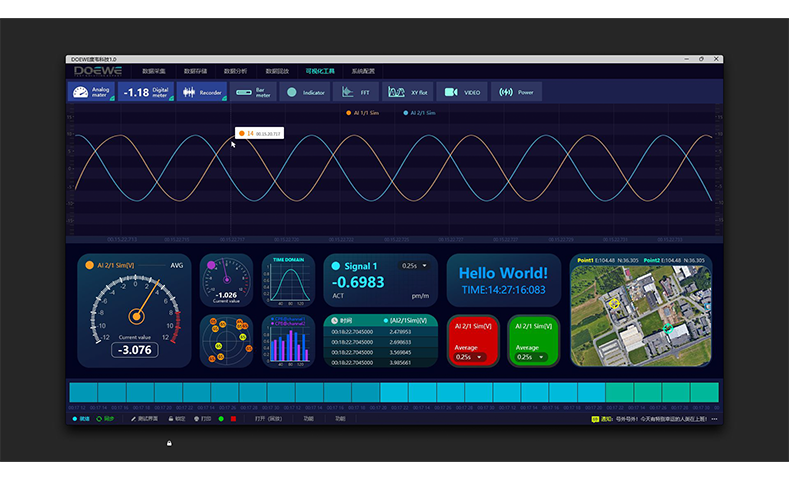
The software platform provides a "one-stop" collection and analysis environment: it works in conjunction with the power analysis channels and irradiance channels, synchronously recording voltage, current, power, and irradiance intensity on both the DC side of the photovoltaic array and the AC side of the inverter. It displays time-domain waveforms in real-time, and if necessary, can switch to the spectrum view for harmonic checks. The system automatically calculates instantaneous and weighted efficiency, and provides evaluation results based on standards such as NB/T 32004-2018, NB/T 32032-2016, etc. After testing, the system allows one-click export of raw data and efficiency curves, generating concise reports for subsequent analysis and archiving.
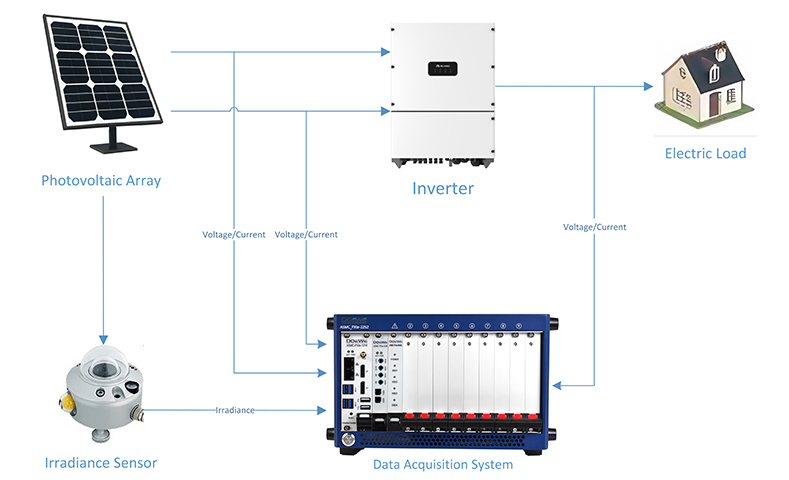
Through the collaboration of hardware and software, the system can perform synchronized measurement and analysis of the photovoltaic array-inverter-load link. During the test, the irradiance sensor is installed near the module array, sending real-time irradiance intensity to the multi-function acquisition card. The voltage on the DC side of the array is introduced into the voltage channel in parallel, while current is sampled using a non-invasive current clamp and connected to the current channel. On the AC output side of the inverter, the voltage leads and current clamps are used to acquire the output electrical parameters. All DC/AC electrical parameters and irradiance data are collected with a unified time base and high-speed storage within the PXIe chassis. The ASMC software immediately generates power curves, I-V/P-V characteristics, and conversion efficiency results. Users can evaluate the inverter’s energy utilization, loss distribution, and control strategy effectiveness under different irradiance conditions, providing reliable data for component selection and system optimization. The test flowchart is shown below:
2.2 Data Acquisition and Test Analysis Software ASMC Features
1. Synchronized Data Collection and Recording: Simultaneously collect voltage/current signals on the DC side and AC side, as well as irradiance channel data, all based on a unified time base. The data is automatically stored in a local database to ensure that electrical parameters correspond precisely with irradiance intensity.
2. Automated Test Process: The software fully controls the power analysis and irradiance channels, automatically performing steps such as data collection and analysis. It calculates weighted efficiency, MPPT efficiency, and maximum efficiency in real-time, simplifying operations and reducing human errors.
3. Inverter Efficiency Calculation and Compliance Determination: Efficiency curves are generated based on real-time input/output power, and the software automatically determines compliance with standards like NB/T 32004-2018 and NB/T 32032-2016. A compliance report is generated accordingly.
4. Time-Domain Waveform and Spectrum Analysis: All channels support real-time waveform display; with a single click, users can switch to spectrum view for easier identification of harmonics, noise spikes, and other abnormal characteristics.
5. I-V Curve and Maximum Power Point (MPP) Location: The I-V curve is generated online, with the MPP position automatically marked and the corresponding power value displayed, providing an intuitive assessment of the component-inverter matching condition.
6. Visualization Monitoring and Alerts: The main interface provides features such as numerical gauges, data curve overlay, and separate display, helping users promptly identify test anomalies (e.g., temperature, power, or efficiency exceeding limits).
7. Data Export and Automated Reporting: After testing, users can export raw data and calculated results with one click. The software automatically generates a report containing efficiency curves, I-V graphs, and key statistics, facilitating archiving and future comparison analysis.
Note: The specific software features are subject to the customer's actual testing requirements.
2.3 Core Parameters of the Test System
1. High Voltage Channels: 4 fixed input channels, range 1000 V RMS (±2000 V PEAK), sampling rate 100 S/s – 2 MS/s @ 24 bit, expandable to 10 MS/s @ 18 bit.
2. High Current Channels: 4 modular input channels, supporting clamp-on transformers or shunt resistors, with synchronized sampling rates matching the voltage channels.
3. Measurement Accuracy: DC ±0.02 % reading ± 0.02 % measurement range; 0.5 Hz–1 kHz ± 0.03 % reading.
4. Power Analysis Bandwidth: 5 MHz, typical THD –95 dB, CMRR > 85 dB @ 50 Hz.
5. Power Analysis Isolation and Safety: Channel-to-chassis 600 V CAT IV / 1000 V CAT III; over-voltage protection 4250 V PEAK (1 min).
6. Power Analysis Data Buffering: 512 MB FIFO, enhancing reliability for continuous high-frequency acquisition.
7. PXIe Time Base Synchronization: DC, AC, current, and irradiance channels share a unified time base, ensuring synchronized and consistent efficiency and I-V calculations.
8. Chassis Occupancy: PXIe 3U single-slot module, can be mixed with other measurement boards.
9. Operating Environment: 0 °C–45 °C; 10 %–80 % RH non-condensing; storage –20 °C–70 °C.
10. Multi-function Acquisition Input Channels: 8 channels, can switch between voltage, IEPE, current, bridge strain, RTD, thermocouples, etc.
11. Multi-function Acquisition Range: Voltage ±2 mV–±100 V; current ±30 mA; bridge ±1 mV–±1000 mV; resistance 10 Ω–30 kΩ.
12. Multi-function Acquisition Maximum Sampling Rate: 0 S/s–5 MS/s (per channel).
13. Multi-function Acquisition Resolution: 0–2 MS/s at 24 bit, > 2–5 MS/s at 18 bit.
14. Multi-function Acquisition Bandwidth: 2 MHz.
15. Multi-function Acquisition Isolation Level: Channel-to-channel / channel-to-chassis ±350 V DC.
16. Reference Calibration Port: Front panel SMB (LEMO) interface for easy external calibration signal injection.
17. Multi-function Acquisition Card Input Connectors: 8 × 0B-LEMO (optional 4 × D-SUB/BNC) for easy field wiring.
18. Local Data Storage: PXIe chassis with built-in high-speed solid-state storage, supporting long-duration, high-frequency data recording without frame loss, and quick export.
3.Advantages and Features of the Solution
1. Integrated Acquisition Platform: Irradiance measurement and power analysis are integrated into the same PXIe chassis. This eliminates the need for multiple devices to simultaneously record irradiance intensity and DC/AC electrical parameters, offering simplified wiring, good synchronization, and high stability.
2. Multi-Channel Parallel Testing: A single chassis can provide 12 current channels, 12 voltage channels, and 16 multi-function input channels with a maximum sampling rate of 2 MS/s. It supports parallel efficiency measurements for multiple inverters or strings, significantly reducing overall testing time.
3. High-Precision Electrical Parameter Measurement: DC measurement accuracy is ±0.02 % reading ± 0.02 % range, and AC measurement has no range errors in the 50 Hz–1 kHz range. Combined with isolated current clamps, it ensures high reliability in comparing input and output power.
4. Expandable Environmental Parameter Collection: Reserved multi-function channels can be connected to sensors for module temperature, ambient temperature, wind speed, etc., enabling the integration of irradiance, temperature, and power data for three-dimensional correlation. This provides complete environmental data for outdoor testing or laboratory simulations.
5. Automatic Efficiency Calculation: The accompanying software automatically calculates instantaneous efficiency, weighted efficiency, and maximum efficiency according to the requirements of standards such as NB/T 32004-2018 and NB/T 32032-2016, and provides compliance judgments.
6. Fast I-V Curve Generation: I-V curves are generated instantly based on synchronized sampling data, visually displaying the maximum power point location and deviations, aiding in the evaluation of inverter MPPT and loss distribution.
7. Full Process Automation: Data collection and analysis are fully automated by the software with one-click execution, reducing manual intervention, minimizing operational errors, and improving testing consistency.
8. One-Click Data Export and Report Generation: After data collection and analysis are completed, the ASMC software allows for one-click export of raw voltage, current data, and spectrum analysis results in common file formats. It also automatically generates test reports for easy archiving and sharing.
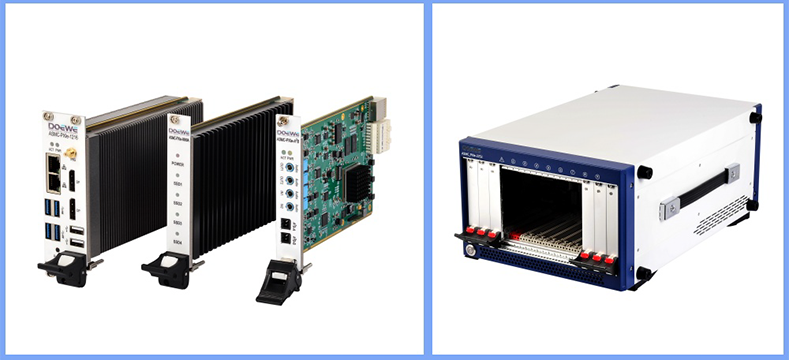
9. Core Hardware Product Introduction
4.1 Multi-Function Acquisition Card
4.1.1 Multi-Function Acquisition Card Overview
The ASMC-PXIe-4054 multi-function acquisition card is specifically designed for voltage-current dynamic characteristic testing. This single-slot 3U PXIe card integrates 4-8 programmable input channels and can be switched to measure high-precision voltage (±2 mV–±100 V), current (±30 mA), IEPE, bridge strain, or RTD thermistor measurements. It can simultaneously collect auxiliary signals from thermocouples and LVDT, and other signals. Each channel supports a maximum sampling rate of 5 MS/s, with a resolution of 24 bits from 0-2 MS/s and 18 bits from 2-5 MS/s. With a 2 MHz analog bandwidth and 512 MB onboard buffering, it can record transient spikes and steady-state drifts without frame loss. The channel-to-channel and channel-to-chassis isolation level is up to ±350 V DC, with a rated withstand voltage of 33 V RMS, ensuring clean waveforms even in high common-mode noise environments. The card also reserves 1 high-speed CAN 2.0 port for synchronized acquisition of external bus data. The card operates within a temperature range of 0 °C–45 °C and stores data in the temperature range of −20 °C–70 °C, with a typical power consumption of ≤15 W (in voltage mode). It serves as the core component for achieving synchronized multi-physical quantity sampling, power calculation, and spectrum analysis within a PXIe chassis.
4.1.2 Core Parameters of the Multi-Function Acquisition Card
1. Input Channels: 4-8 channels (configurable for: voltage, IEPE, current, bridge strain, RTD, etc.)
2. Signal Range:Voltage: ±2 mV ~ ±100 V,Current: ±30 mA,Resistance: 10 Ω ~ 30 kΩ
3. Maximum Sampling Rate: 5 MS/s (per channel)
4. Resolution:24 bit for 0 ~ 2 MS/s,18 bit for > 2 ~ 5 MS/s
5. Analog Bandwidth: 2 MHz
6. Isolation Level: Channel-to-channel / channel-to-chassis ±350 V DC
7. Onboard Buffer: 512 MB
8. High-Speed Interface: PXIe 3U single-slot, integrated 1 × CAN 2.0 synchronization port
9. Output Options: AOUT-8 version provides isolated ±5 V / ±10 V / ±30 mA analog output
10. Operating Temperature Range: 0 ℃ ~ +45 ℃; Storage: −20 ℃ ~ +70 ℃
4.2 Power Analysis Card
4.2.1 Power Analysis Card Overview
This power analysis card adopts a 3U single-slot PXIe form factor and is specifically designed for four-phase power measurement and efficiency evaluation. The card integrates 4 fixed high-voltage inputs, with a range of 1000 V RMS (±2000 V PEAK, CF=2). It also offers optional pluggable current sub-modules for use with clamp-on transformers or shunt resistors to achieve synchronized voltage-current sampling. The sampling rate ranges from 100 S/s to 2 MS/s with 24-bit resolution, expandable to 10 MS/s (18-bit). The 5 MHz analog bandwidth is sufficient for covering inverter harmonics and transient analysis. DC accuracy is ±0.02% reading ± 0.02% range, while AC error in the 0.5 Hz to 1 kHz range is only ±0.03% reading, with typical THD of −95 dB. Channel-to-chassis isolation is 600 V CAT IV / 1000 V CAT III, with over-voltage protection of 4250 V PEAK and insulation withstand voltage of 3750 V RMS (1 min), ensuring long-term safe operation in high-voltage environments. Onboard 512 MB FIFO and PXIe x8 backplane passthrough allow for high-speed storage writing without frame loss at high sampling rates. SNR, ENOB, and other indicators maintain excellent levels (SNR 126 dB, ENOB 20.6 bit at 2 kS/s). The safety banana interfaces, hot-swappable current modules, and modular architecture provide a high-precision, high-bandwidth, and easily expandable measurement solution for high-voltage power testing scenarios, such as photovoltaic inverter efficiency, locomotive traction, and motor drive systems.
4.2.2 Core Parameters of the Power Analysis Card
1. Input Channels: 4 fixed high-voltage voltage channels + modular current input, supporting 4-phase power measurement
2. Power Measurement Range: 1000 V RMS (±2000 V PEAK, CF = 2), optional current sub-modules up to 40 A (or other specifications)
3. Sampling Rate / Resolution: 100 S/s – 2 MS/s @ 24 bit; > 2 MS/s – 10 MS/s @ 18 bit
4. Analog Bandwidth: 5 MHz, capable of covering high-order harmonic analysis of inverters
5. Measurement Accuracy (Typical):DC ±0.02% reading ± 0.02% range,0.5 Hz – 1 kHz ±0.03% reading
6. Isolation and Safety: 600 V CAT IV / 1000 V CAT III; over-voltage protection 4250 V PEAK; insulation withstand voltage 3750 V RMS (1 min)
7. Dynamic Performance: THD −95 dB; CMRR > 85 dB @ 50 Hz
8. Channel Synchronization: Multiple channels share the PXIe time base, minimizing voltage-current phase measurement errors
9. Data Buffering and Transmission: Onboard 512 MB FIFO, high-speed data storage through PXIe x8 backplane, continuous high-frequency sampling without frame loss
10. Interface and Wiring: Safety banana sockets (high voltage) + replaceable current sub-modules, supporting fast field wiring and maintenance