1. Introduction
We frequently encounter video signals in our daily lives. They are typically composed of three primary color signals: red, green, and blue. These three primary color signals can generate images of various colors through different proportions and luminance combinations. Video signals have a wide range of applications, including television broadcasting, film production, video conferencing, and surveillance systems.
With technological advancements, the transmission quality and processing efficiency of video signals continue to improve. Overall, however, the fundamental composition principles and basic formats of video signals are generally similar. Therefore, understanding the composition principles and transmission formats of video signals is highly beneficial for testing related video signal transmission systems.
To ensure the quality and stability of video signals, strict testing and evaluation of their various indices are necessary. These indices include, but are not limited to, video signal amplitude, luminance non-linearity, K-factor, stability, signal-to-noise ratio (SNR), hue, video level, audio channels, and audio signal quality. Testing these indices ensures that video signals do not suffer from distortion, noise, or other issues during transmission, guaranteeing viewers a clear, smooth, and vivid visual experience. Simultaneously, these indices are crucial standards for measuring the performance and quality of video equipment, holding significant importance for both manufacturers and users.
Therefore, this document will focus on the transmission channel indices for CCTV monitoring systems outlined in the JTG 2182-2020 standard, providing corresponding introductions to video signal formats and video channel testing indices.
2. Principles of Video Signals
2.1 Composition of Video Signals
A video signal consists of a luminance signal, a chrominance signal, and synchronization signals.
● Luminance Signal (Y): Contains the intensity (brightness or darkness) information of the video image.
● Chrominance Signal (C): Contains the color information of the video image.
● Synchronization Signals: Control the scanning of the signal on displays like television screens.
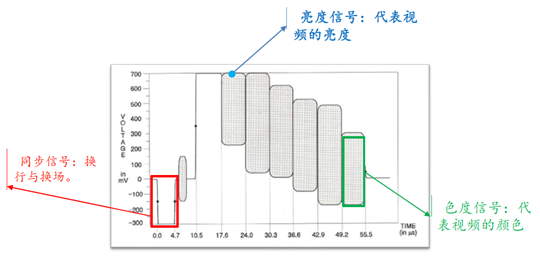
Figure 1: Composition of Video Signal
2.1.1 Luminance Signal
The luminance signal represents brightness levels by amplitude values. As shown in Figure 2, this is a luminance staircase signal. The brightness level of each step, indicated by red dots, is: 140mV, 280mV, 420mV, 560mV, 700mV. Different steps represent different brightness levels, with the minimum being black, the maximum being white, and intermediate levels being gray.
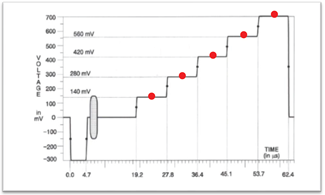
Figure 2: Luminance Signal
2.1.2 Chrominance Signal
The chrominance signal consists of hue and saturation.
Hue refers to the relative lightness or darkness of an image, manifested as color in a color image. It is a key characteristic of color, determining its fundamental nature. As shown in Figure 3:
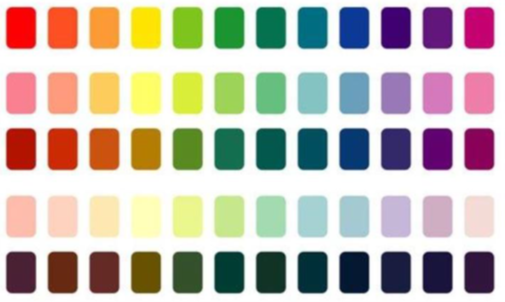
Figure 3: Hue of Chrominance Signal
Saturation refers to the vividness of a color, also known as its purity. Pure colors are highly saturated, such as bright red or bright green.
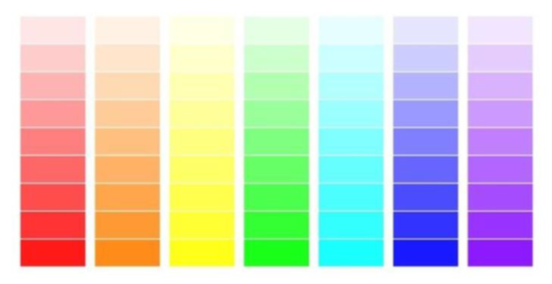
Figure 4: Saturation of Chrominance Signal
Hue and saturation are converted into color difference signals through a specific process, which are then modulated onto a color subcarrier. The modulated color difference signal is the chrominance signal. Its phase represents the hue (color), and its amplitude represents the saturation.
The signal highlighted by the red box in the figure below is the chrominance signal:
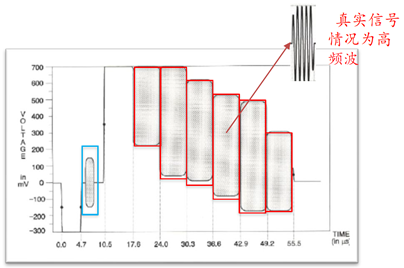
Figure 5: Chrominance Signal
The signal within the blue box is a reference signal used for decoding the chrominance signal.
2.1.3 Synchronization Signals
Synchronization signals control the scanning of the signal on the display, including line synchronization (H Sync) and field synchronization (V Sync). These are shown within the blue box in Figure 6.
● Line Synchronization Signal (H Sync): Synchronizes the horizontal line scan. It occurs once per line, signifying the end of the current line scan and the start of a new line.
● Field Synchronization Signal (V Sync): Synchronizes the vertical field scan. It occurs once per field, signifying the end of the current field scan and the start of a new field.
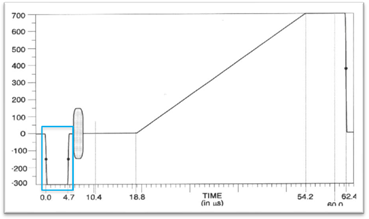
Figure 6: Synchronization Signals
The concepts of "field" and "frame" are distinct. A "field" refers to one scan from the top to the bottom of the screen. A "frame" refers to the complete image data that forms a full picture. In progressive scan, one field equals one frame. In interlaced scan, one frame consists of two fields: the odd field and the even field.
2.2 Video Signal Formats
In the JTG 2182 standard for testing transmission channel indices of CCTV monitoring systems, there are primarily three video signal formats: Standard Definition Analog Composite Video Signal (CCVS), High Definition Analog Component Video Signal (RGB, YPbPr), and High Definition Digital Component Video Signal (RGB, YCbCr).
In our signal generator (VSG), the interface forms are:
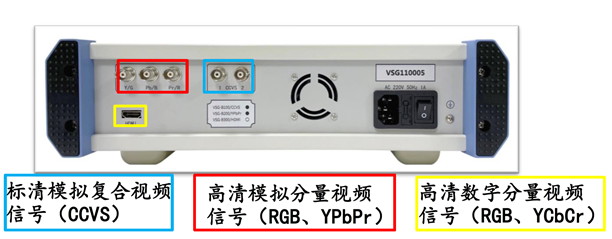
Figure 7: VSG Interface Forms
2.2.1 Standard Definition Analog Composite Video Signal (CCVS)
The Standard Definition Analog Composite Video Signal (CCVS) is transmitted via a single BNC interface (as shown below) with 75Ω impedance. "Standard Definition" indicates a resolution of 720×576. "Analog" signifies that the transmitted signal is analog. "Composite" means the luminance signal, chrominance signal, and synchronization signals are combined into one composite signal for transmission.
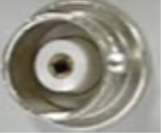
Figure 8: CCVS Interface
2.2.2 High Definition Analog Component Video Signal (RGB, YPbPr)
The High Definition Analog Component Video Signal (RGB, YPbPr) is transmitted via three sets of 75Ω BNC interfaces, as shown in Figure 9. "High Definition" indicates a resolution of up to 1920×1080. "Analog" signifies that the transmitted signal is analog. "Component" means the luminance signal, chrominance signal, and synchronization signals are transmitted separately.
In the RGB format, the luminance and chrominance information are carried by the R/G/B signals respectively, with the synchronization signal embedded within the G signal. In the YPbPr format, the Y signal carries the luminance and synchronization signals, while Pb and Pr carry the chrominance information.
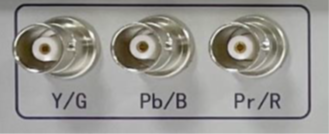
Figure 9: RGB / YPbPr Interfaces
2.2.3 High Definition Digital Component Video Signal (RGB, YCbCr)
In the High Definition Digital Component Video Signal (RGB, YCbCr), the signal is transmitted via one HDMI interface (as shown below). "High Definition" indicates a resolution of up to 1920×1080. "Digital" signifies that the transmitted signal is digital. "Component" means the luminance signal, chrominance signal, and synchronization signals are transmitted separately.
In the RGB format, the luminance and chrominance information are carried by the R/G/B signals respectively, with the synchronization signal embedded within the G signal. In the YCbCr format, the Y signal carries the luminance and synchronization signals, while Cb and Cr carry the chrominance information.
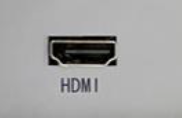
Figure 10: HDMI Interface
3. Analysis of Relevant Video Indices
3.1 Video Signal Amplitude (White Bar Amplitude / Video Level)
The standard video signal amplitude is 1V peak-to-peak (p-p). Here, the primary focus is the white bar amplitude, known as the video level: 700mV.
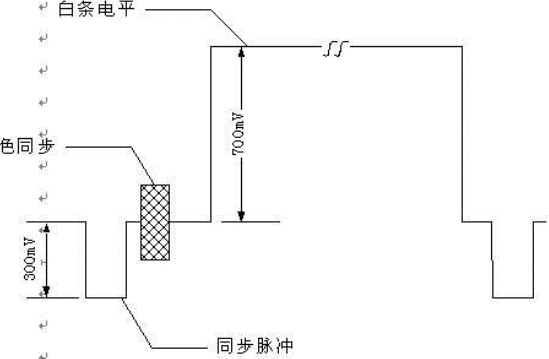
Figure 11: White Bar Amplitude
Impact on Video: Values exceeding the specification will cause the image to be too bright or too dark.
Typical index example:
JTG 2182-2020 Standard 4.3.2 Closed-Circuit Television Monitoring System Measured Items Eighth Item Transmission Channel Index (Page 7):
8.1 Standard-Definition Analog Composite Video Signal
• △8.1.1 Video Level(700±30)mV
3.2 Video Signal Amplitude (Synchronization Pulse Amplitude)
Here it is mainly the synchronization pulse amplitude, that is, the amplitude of the synchronization pulse signal: 300mV.
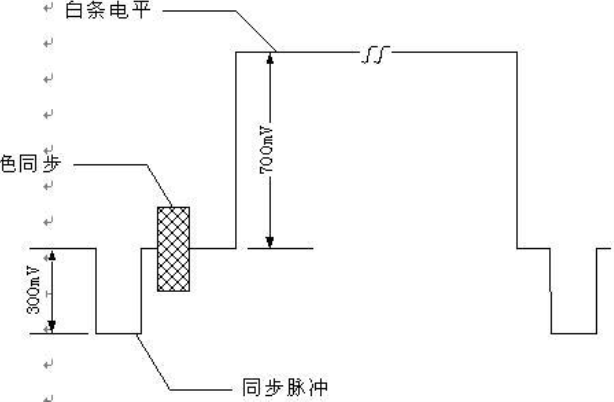
Figure 12 Synchronization Pulse Amplitude
Impact of synchronization pulse amplitude on video: Exceeding the index value will cause image distortion, and even the image cannot be viewed.
Typical index example:
JTG 2182-2020 Standard 4.3.2 Closed-Circuit Television Monitoring System Measured Items Eighth Item Transmission Channel Index (Page 7):
8.1 Standard-Definition Analog Composite Video Signal
• △8.1.2 Synchronization Pulse Amplitude(300±20)mV
3.3 Luminance Linearity (K-Factor)
It is used to measure image damage, and the distortion here is short-term waveform distortion. Generally, "2T sine-squared wave distortion" (K-2T) is used as the test index.
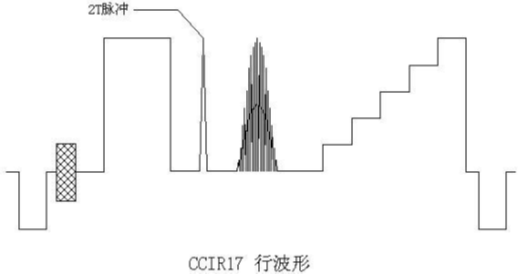
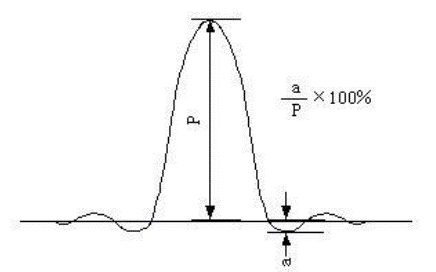
Figure 13 Luminance Linearity (K-Factor)
Impact of luminance linearity (K-factor) on video: It will cause the image to have multiple contours, cause ghosting, and reduce the clarity.
Typical index example:
JTG 2182-2020 Standard 4.3.2 Closed-Circuit Television Monitoring System Measured Items Eighth Item Transmission Channel Index (Page 8):
8.1 Standard-Definition Analog Composite Video Signal
• △8.1.3 Echo E <7%
3.4 Luminance Nonlinearity
The linearity of the change from the blanking level (black level) to the white level. Calculate the maximum difference between the corresponding step amplitude values.
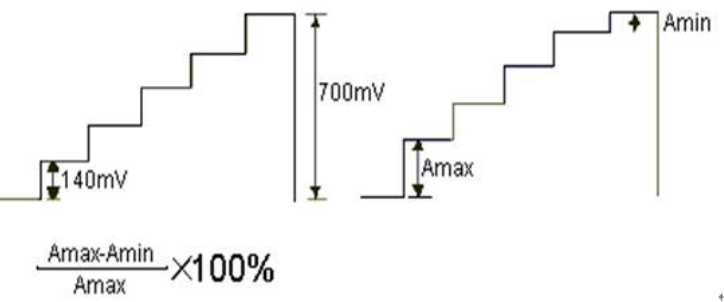
Figure 14 Luminance Nonlinearity
Impact of luminance nonlinearity on video: 1. The image loses grayscale and reduces layers. 2. The resolution is reduced, and color saturation distortion is generated (because the chrominance signal is superimposed on the luminance signal).
Typical index example:
JTG 2182-2020 Standard 4.3.2 Closed-Circuit Television Monitoring System Measured Items Eighth Item Transmission Channel Index (Page 8):
8.1 Standard-Definition Analog Composite Video Signal
• 8.1.4 Luminance Nonlinearity≤5%
3.5 Differential Gain (DG)
The chrominance signal amplitude distortion caused by the change of the image luminance signal amplitude. Calculate the maximum difference between the chrominance amplitude values on each step of the step signal with chrominance modulation.
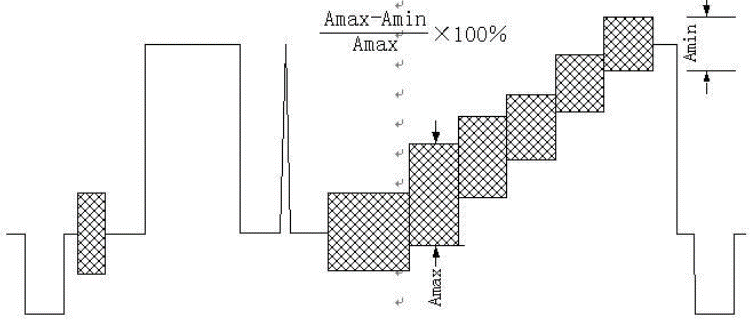
Figure 15 Differential Gain
Impact of differential gain (DG) on video: Color saturation distortion under different luminance backgrounds affects the color effect. For example, when a person wearing bright red clothes walks from a dark place to a bright place, the bright red clothes will become darker or lighter.
Typical index example:
JTG 2182-2020 Standard 4.3.2 Closed-Circuit Television Monitoring System Measured Items Eighth Item Transmission Channel Index (Page 8):
8.1 Standard-Definition Analog Composite Video Signal
• 8.1.7 Differential Gain≤10%
3.6 Differential Phase(DP)
The chrominance signal phase distortion caused by the change of the image luminance signal amplitude. Calculate the difference between the phase angle of the chrominance subcarrier of each step signal with chrominance modulation and the phase angle of the subcarrier signal on the blanking level, with lead being positive.
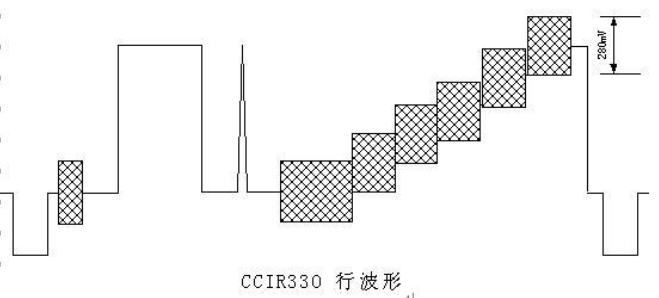
Figure 16 Differential Phase
Impact of differential phase (DP) on video: Under different luminance backgrounds, the hue is distorted, affecting the color effect. For example, when a person wearing bright red clothes walks from a dark place to a bright place, the bright red clothes will turn yellow or purple.
Typical index example:
JTG 2182-2020 Standard 4.3.2 Closed-Circuit Television Monitoring System Measured Items Eighth Item Transmission Channel Index (Page 8):
8.1 Standard-Definition Analog Composite Video Signal
• 8.1.8 Differential Phase≤10°
3.7 Chrominance/Luminance Gain Difference
The change in the amplitude ratio of the luminance component and chrominance component in the output signal is called the chrominance/luminance gain difference.
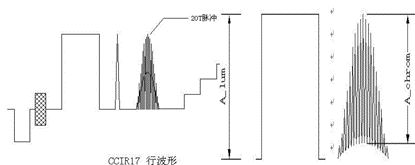
Figure 17 Chrominance/Luminance Gain Difference
Impact of chrominance/luminance gain difference on video: It affects the saturation distortion of the image. For example, if the gain difference is negative, the image color becomes light and dark,and the person's expression is not good; if the gain difference is positive, the color is too strong, the outline is not clear, similar to a children's coloring painting, lacking a sense of reality.
Typical index example:
JTG 2182-2020 Standard 4.3.2 Closed-Circuit Television Monitoring System Measured Items Eighth Item Transmission Channel Index (Page 8):
8.1 Standard-Definition Analog Composite Video Signal
• 8.1.5 Chrominance/Luminance Gain Inequality±5%
3.8 Chrominance/Luminance Delay Difference
The difference in the time relationship between the corresponding parts of the luminance component and the chrominance component's modulated chrominance waveform in the output.
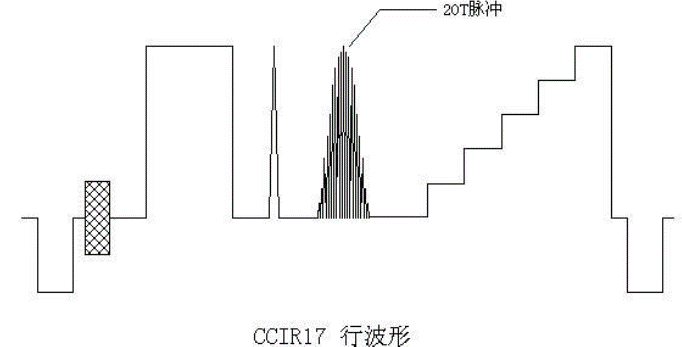
Figure 18 Chrominance/Luminance Delay Difference
Impact of chrominance/luminance delay difference on video: Color registration is inaccurate, and color fringing appears in the horizontal direction, which is more sensitive to the human eye.
Typical index example:
JTG 2182-2020 Standard 4.3.2 Closed-Circuit Television Monitoring System Measured Items Eighth Item Transmission Channel Index (Page 8):
8.1 Standard-Definition Analog Composite Video Signal
• 8.1.6 Chrominance/Luminance Delay Difference≤100ns
3.9 Frequency Response
Within the frequency band from low frequency to high frequency, the gain change between the input and output of the channel relative to the reference point frequency. The test signal is a multi-burst signal. The frequencies are: 0.5MHz, 1MHz, 2MHz, 4MHz, 4.8MHz, 5.8MHz.
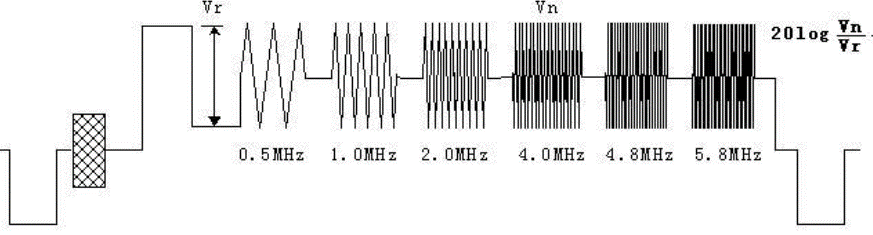
Figure 19 Frequency Response
Impact of frequency response on video: It affects the image clarity. If the high-frequency part is greatly attenuated, the image details become light and the edge contours are unclear.
Typical index example:
JTG 2182-2020 Standard 4.3.2 Closed-Circuit Television Monitoring System Measured Items Eighth Item Transmission Channel Index (Page 8):
8.1 Standard-Definition Analog Composite Video Signal
• △ 8.1.9 Frequency Response (within 5.8MHz bandwidth) ±2dB
3.10 Signal-to-Noise Ratio
The ratio between the signal itself and the noise during signal transmission.
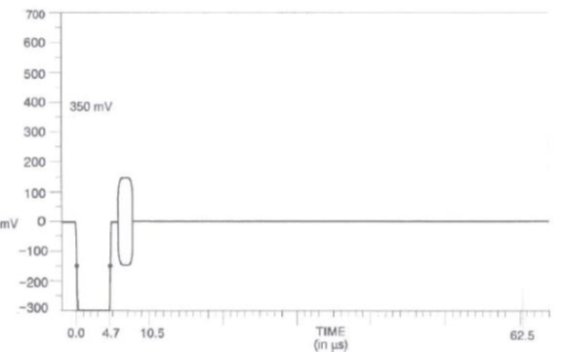
Figure 20 Signal-to-Noise Ratio
Impact of signal-to-noise ratio on video: The larger the signal-to-noise ratio, the greater the noise in the transmission channel, and the worse the image quality.
Typical index example:
JTG 2182-2020 Standard 4.3.2 Closed-Circuit Television Monitoring System Measured Items Eighth Item Transmission Channel Index (Page 8):
8.1 Standard-Definition Analog Composite Video Signal
• △8.1.10 Video Signal-to-Noise Ratio (Weighted)≥56dB
3.11 Inter-Channel Delay Difference
In component video signals( YCR(PR)CB(PB)与RGB ),the delay difference between channels, such as between the R signal and G signal, and between the R signal and B signal.
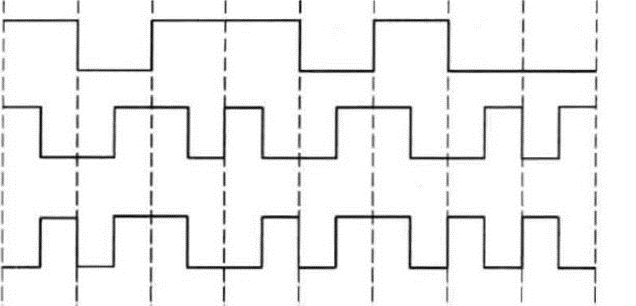
Figure 21 Inter-Channel Delay Difference
Inter-channel delay difference: The greater the inter-channel delay, the greater the error in the transmission of luminance and chrominance signals, resulting in worse image formation.
Typical index example:
JTG 2182-2020 Standard 4.3.2 Closed-Circuit Television Monitoring System Measured Items Eighth Item Transmission Channel Index (Page 8):
8.2 High-Definition Y、CR(PR)、CB(PB) Video Signal
• 8.2.7 Y/CB(Y/PB)、Y/CR(Y/ PR) Signal Delay Difference±10ns