I. Solution Overview
This solution targets the R&D and validation of automotive motors (traction/drive motors, steering motors, pump/fan motors, etc.) and provides a torque‑centric testing and analysis solution. The engineering value of an automotive motor ultimately shows up in “how much torque the output shaft can deliver, whether the torque is stable, and whether the torque response meets requirements under different operating conditions.” Accordingly, this solution uses torque, speed, and their derived mechanical power as the main thread, while simultaneously acquiring electrical quantities such as voltage and current, as well as environmental parameters such as temperature. It builds a closed‑loop evaluation of “mechanical output—electrical energy input—efficiency and losses,” providing reliable data support for performance assessment and root‑cause analysis.
Torque is a physical quantity that describes the effect of a force causing an object to rotate about an axis, and can be understood simply as “how hard it twists the shaft / drives the load.” In the most common case, torque equals the product of the applied force and the moment arm (F×r), with units of N·m. For a motor, higher torque means stronger load‑carrying capability at the output shaft; at the same power, the lower the speed, the higher the required torque. Torque and speed together determine mechanical output power: P_mech = Torque × 2πn/60 (n is speed in rpm). Combined with electrical power, efficiency and losses can be calculated, enabling quantitative comparison across motors, control strategies, and operating conditions.
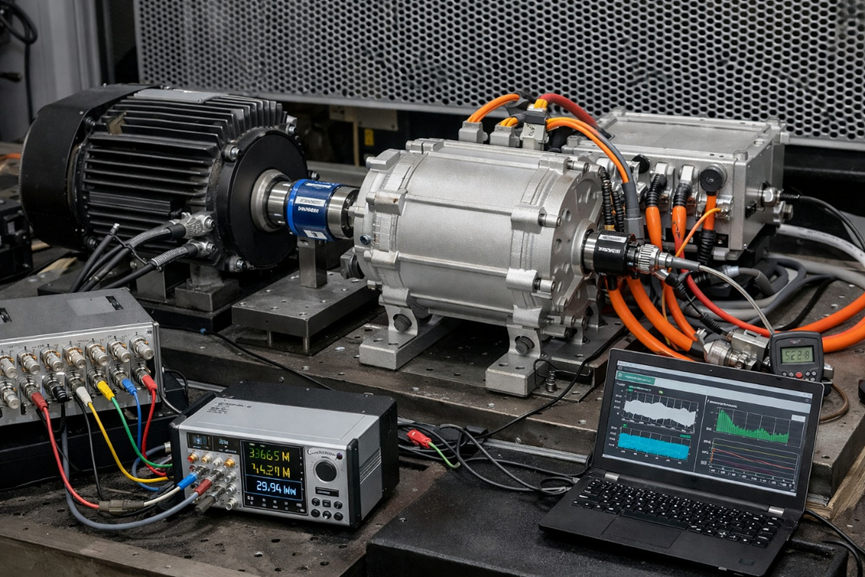
In a typical test‑bench setup, the system uses torque and speed as the core measurements. Angle/encoder signals can be connected as needed for per‑revolution analysis, while DC bus voltage/current and motor phase voltage/phase current are acquired synchronously; environmental parameters such as temperature can also be added. Voltage and current signals can be captured directly by the DAQ system, or isolated and scaled using high‑voltage differential probes, shunts, Hall‑effect/Rogowski current sensors, etc. This ensures measurement safety and makes it easy to match sensor outputs to DAQ input ranges. The solution can be adapted to three‑phase or multi‑phase motors and drive systems at different voltage levels, and can interface with dynamometers, controllers, and power supply/load systems to cover multi‑condition testing needs during R&D and validation.
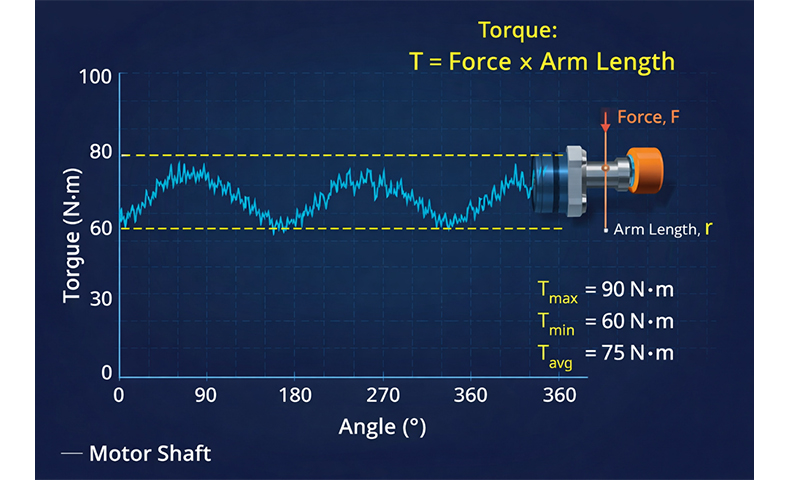
Beyond steady‑state torque, automotive motors also need attention on torque ripple—i.e., the periodic fluctuation of torque within one revolution. Torque ripple can lead to noise and vibration (NVH), low‑speed crawl judder, reduced efficiency, and early wear of mechanical components. A common metric is: Torque ripple (%) = (Tmax − Tmin) / Tavg × 100, where Tmax/Tmin/Tavg are the maximum/minimum/average torque within one revolution. Torque ripple has both amplitude and frequency characteristics; excessive filtering can mask the true ripple characteristics. It is recommended to keep the raw waveform and perform traceable filtering and statistics during analysis.
This solution supports per‑revolution torque statistics using angle/encoder signals: using a fixed angular position each revolution as a trigger, it computes the max/min/average torque within a one‑revolution window and continuously generates a torque‑ripple trend curve. The results can be time‑base aligned and compared with speed, sound pressure/sound level, vibration, temperature, etc., to help pinpoint torque fluctuations caused by cogging effects, harmonic currents, or mutual inductance variations.
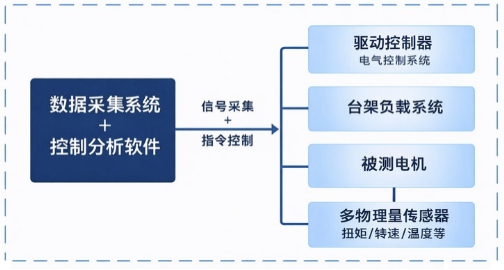
The data acquisition system is the core module. It synchronously acquires, stores, and manages triggers for signals such as torque, speed, voltage, and current, and can be extended with bus acquisition capabilities. The controller in the system runs ASMC test software to handle channel configuration, real‑time display, and power/efficiency calculations. It supports automatic execution by test operating conditions, records key results, and generates reports, reducing manual intervention while improving data consistency and traceability.
Through deep integration of hardware and software, the solution provides comprehensive test management for motor electrical energy input, mechanical output, and key operating states. It is suitable for R&D validation, benchmarking analysis, and integrated bench/vehicle testing. The system architecture is illustrated below:
II. Test System Description
2.1 Principle of Operation
Through coordinated hardware and software, the platform uses torque and speed as reference quantities to synchronously measure and analyze the motor under test across different operating conditions, covering mechanical output, electrical energy input, and key operating states. During testing, the motor is connected to the drive controller and the bench load system (e.g., a dynamometer). Torque and speed/angle are provided by the dynamometer, a torque flange/dynamic torque sensor, and an encoder, and are fed into the acquisition system via analog or digital interfaces. Voltage signals can be connected directly to the DAQ voltage inputs (e.g., DC bus voltage, phase voltage), or—depending on voltage level, isolation/safety requirements, and site interference—be scaled and isolated using high‑voltage differential probes or isolated transducers before connection. Similarly, current signals can be connected directly to DAQ current inputs, or be converted via shunts, Hall‑effect sensors, or Rogowski coils as required by the setup and measurement needs. When necessary, temperature and bus information such as CAN/LIN are acquired simultaneously so that mechanical output, electrical energy input, and control states are aligned on a common time base. The ASMC control and analysis software configures sampling rate, ranges, and sensor scaling factors in one interface, displays real‑time waveforms and values for torque/speed and voltage/current, and calculates mechanical power, electrical power, energy, and efficiency online. After the test, the system automatically saves raw data and computed results, and supports export and replay. For different motor models or different benches, the same acquisition and analysis platform can be reused by adjusting wiring and channel configuration, enabling rapid test changeover.
Torque and speed signals can be provided by the dynamometer, torque flange/dynamic torque sensor, and encoder. Torque can be input to the acquisition system via analog signals (e.g., ±10 V) or a digital interface. For speed and angle, it is recommended to use encoder pulses (A/B/Z) or a once‑per‑revolution reference pulse into a counter channel, to obtain a high‑precision speed/angle time base and maintain strict synchronization with voltage and current. For scenarios that require dynamic response evaluation, it is recommended to record load commands/control status (bus or I/O) simultaneously to align torque response with electrical changes.
Torque‑ripple calculation can use a per‑revolution segmentation method triggered by rotation angle: using a fixed edge of the angle signal as the start of each revolution, define a one‑revolution window and compute Tmax, Tmin, and Tavg, then output the torque‑ripple (%) trend versus time or speed. This method is sensitive to speed fluctuations; it is recommended to record speed stability during the test and evaluate steady‑speed and speed‑changing segments separately. Because torque ripple has both amplitude and frequency characteristics, it is recommended to retain the raw torque waveform; filtering should be performed in the analysis stage with full traceability. Together with the torque‑ripple vs speed curve and acoustic/vibration comparisons, features such as “lower ripple in steady‑speed regions” can be extracted to support control strategy and structural optimization.
2.2 ASMC Test Software Overview
The ASMC control and analysis software is installed on the PXIe controller and integrates device management, process control, and data analysis. Designed for multi‑channel synchronous acquisition and display in motor test benches, it allows torque/speed/angle, voltage/current, temperature, and other channels to be configured in one interface; sensor scale factors and ranges can be set; waveforms, numeric tables, and trend curves are displayed in real time. Built‑in functions compute mechanical power and electrical energy, outputting metrics such as torque, mechanical power, electrical power, energy, and efficiency, and support result comparisons across operating conditions and prototypes. The software supports automatic execution of test procedures by operating condition, records key results, and generates standardized test reports with one click, supporting export to Excel, PDF, and other formats.
For torque analysis, the software supports per‑revolution statistics to obtain Tmax/Tmin/Tavg, computes torque ripple, and displays it aligned on the same time base with speed, acoustic/vibration, and temperature signals. It also supports incorporating torque and speed into the efficiency calculation chain, enabling comprehensive comparative analysis of “mechanical output—electrical energy input—NVH/temperature rise” and facilitating the identification of abnormal fluctuations caused by cogging effects, harmonic currents, and other factors.
In motor and drive‑system testing, the software can perform statistical analysis on dynamic processes such as start/stop, step changes, loading, and acceleration/deceleration. Combined with bus data, it can correlate control commands and state variables with torque and electrical results, helping pinpoint issues such as efficiency fluctuation, over‑current/over‑voltage, and low‑speed judder. The software architecture is flexible and configurable, allowing calculation items and report templates to be extended per project needs, providing efficient, reliable, and traceable automated test support for motor development, testing, and quality validation. A software illustration is shown below:
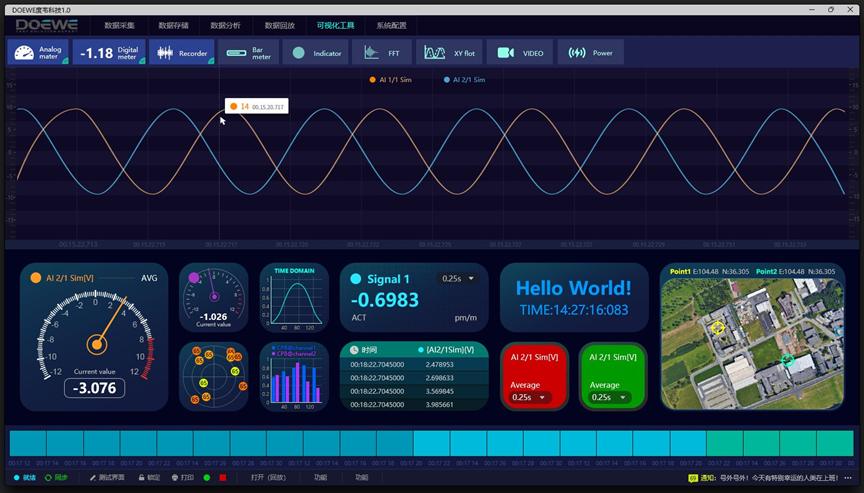
Figure 4 ASMC Test and Analysis Software (Illustration)
III. Key Advantages
1.Core evaluation capability focused on torque output: supports synchronous acquisition and real‑time display of torque/speed, covering typical operating conditions such as steady state, start/stop, and loading, providing quantitative basis for load‑carrying capability and torque response assessment.
2.Torque‑ripple evaluation for NVH: supports per‑revolution statistics to calculate torque ripple, and aligns/compares it on the same time base with sound, vibration, temperature, and other parameters to quickly locate the source of low‑speed crawl judder and abnormal fluctuations.
3.Closed‑loop efficiency evaluation from mechanical output to electrical input: supports synchronous acquisition of DC bus and phase voltage/phase current and automatically computes key electrical quantities such as power and energy; jointly computes mechanical power and efficiency with torque/speed, enabling loss analysis.
4.Multi‑source data synchronization: torque, speed, electrical measurements, temperature, and CAN/LIN bus data can be aligned on a unified time base for comprehensive analysis of control states—mechanical output—electrical input.
5.Automation and high efficiency: via test procedure templates and parameterized configuration, enables one‑click execution, automatic recording, and report generation, reducing manual operation and missing‑test risk and improving bench test efficiency.
6.Safety and scalability: supports external voltage/current sensors and isolated measurement schemes, adapting to different voltage/current levels; the PXIe modular architecture scales flexibly with channel count and bandwidth requirements.
7.Intuitive data analysis and comparison: supports real‑time display, offline replay, and multi‑condition comparisons to quickly locate abnormal waveforms, efficiency fluctuations, and sources of energy loss.
8.Open interfaces and system integration: supports data exchange and process linkage with host computers/bench control systems via interfaces, making it easy to integrate into existing test platforms and traceability systems.
9.Customizable extensions: acquisition channels, calculated metrics, and report templates can be customized according to motor type, test specifications, and enterprise workflows to meet project‑specific requirements.
IV. Key Hardware Products
4.1 Data Acquisition Module
4.1.1 Overview
The control, storage, and acquisition module is integrated into a single chassis based on the PXIe modular architecture. It can be combined with the ASMC PXIe 2252 high‑bandwidth hybrid‑backplane chassis, the PXIe 1216 embedded controller, and the PXIe 8016 high‑speed storage card to provide device scheduling, data processing, and high‑speed buffering. The chassis offers regulated power, enhanced cooling, and intelligent monitoring, and supports multi‑chassis synchronization. The controller provides high‑performance computing and high‑speed PXIe switching interconnects. The storage card provides high‑bandwidth continuous write capability to meet long‑duration, multi‑channel synchronous recording requirements for motor power testing. Depending on the project, voltage/current acquisition, temperature, vibration, and bus‑interface cards can be installed in the chassis to enable integrated acquisition of electrical, mechanical, and state signals. Product illustrations of the control and storage module are shown below:
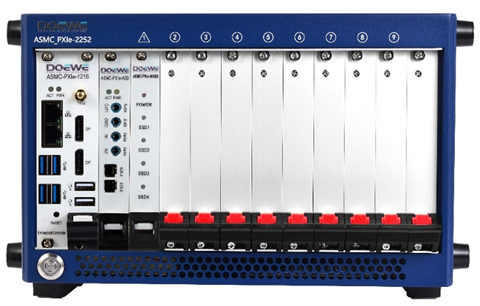
Figure 5 Data Acquisition Module (Product Image)
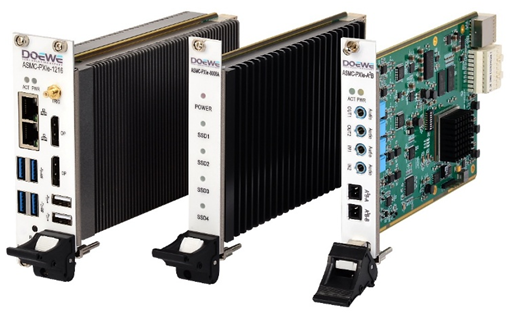
Figure 6 PXIe Acquisition Cards (Product Image)
4.1.2 Key Specifications:
ASMC PXIe 2252 Chassis
● 1 system slot + 1 timing slot + 7 hybrid slots; system bandwidth 24 GB/s, single‑slot 8 GB/s
● Integrated 600 W industrial power supply and enhanced cooling; operating −20 °C to +70 °C / 10% to 90% RH
● Provides 10 MHz clock I/O, supporting multi‑chassis synchronization
ASMC PXIe 1216 Controller
● Intel® i7-6820EQ (2.8 GHz, up to 3.5 GHz Turbo), 16 GB RAM (expandable to 32 GB)
● 512 GB SSD; local bus bandwidth up to 24 GB/s; supports P2P direct connection and real‑time power/temperature monitoring
● Dual‑slot 3U structure; operating 0 °C to +50 °C
ASMC PXIe 8016 High‑Speed Storage Card
● NVMe solid‑state storage (up to 16 TB), PCIe x8 interface
● Sustained read/write bandwidth > 6 GB/s; onboard switch chip supports data pass‑through and power consumption monitoring
● Operating 0 °C to +50 °C
Sensor Power Supply Card
● Programmable DC 5–24 V, ≤ 300 mA per channel; 24 V / 4 mA IEPE constant current source
● Real‑time power‑on and undervoltage monitoring; unified regulated power supply
Analog Acquisition Cards
● General high‑speed: up to 32 single‑ended or 16 differential, 16‑bit, 500 kS/s, programmable ±10 V range
● Synchronous dynamic: 8 channels, 24‑bit, 8 S/s–102.4 kS/s, built‑in anti‑aliasing filters and AC/DC coupling
● Direct streaming to the storage layer; sustained per‑slot bandwidth 8 GB/s
Digital I/O / Bus Acquisition Cards
● 16 isolated RS‑485 DI channels, +6 to +30 V high level; 1,200–115,200 bps configurable
● Plug‑and‑play support for MT/T 899-2000 NRZ and Modbus RTU; expandable to CAN, UART, Ethernet
● Shared PXIe 10 / 100 MHz time base to achieve nanosecond‑level synchronization of analog and digital acquisition; field‑swappable BNC / Lemo / M12 connectors
Doewe Technology has always been committed to developing innovative, unique and reliable product solutions in the field of data acquisition. We deeply understand that these elements are the cornerstone for enterprises to gain a foothold in market competition. For this reason, we derive innovative inspiration from customers' real application needs, rather than merely showcasing flashy product features. By continuously optimizing and upgrading data acquisition solutions, Doewe Technology helps partners move towards an efficient and accurate future. Welcome to choose Doewe Technology and jointly open a new chapter in data acquisition.